I like Bernie Sanders. I’ve never donated to a political campaign before, but I’ve felt inspired to donate to his. But it’s made me wonder: where exactly does the money I donate to him go? And how much more does he need to be a viable candidate?
Neither is an easy question to answer. The path that political contributions take is a complicated one. But we can assume that, aside from administrative costs, the main expense for the Sanders campaign will be advertising, and TV advertising in particular.
The goal of campaign advertising is to sway potential voters. As a little thought experiment, let’s try to estimate how cost-effective political ads are at doing that. Two factors are at play when we think about the impact of a given ad – the number of voters that the ad reaches and what fraction of them change their minds as a result:
ad impact = (# voters reached) × (% minds changed)
Estimating the number of primary voters reached by each dollar spent on advertising is actually pretty straightforward. All we need is to figure out the CPM (cost per thousand views) for TV commercials and multiply by what percentage of those viewers are Democratic primary voters:
(# voters reached /$) = (1000 /CPM) × (% Democratic primary turnout)
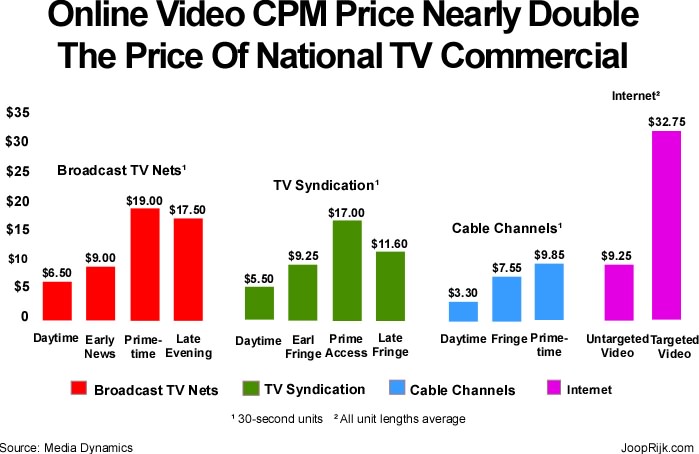
According to Media Dynamics, an advertising analyst firm, it seems that TV ads have about a CPM of $10 on average – that is, they reach a thousand viewers for every $10 spent:
And voter turnout in the last presidential primaries in 2012 was an abysmal 17.3%, so we can estimate about half of that – say, 8.6% – for Democratic primary turnout specifically.
But surely there is some targeting going on with political ads – for example, you wouldn’t air an ad during a show whose primary demographic is children or teens. So let’s add a small multiplier of ×1.5 to reflect the fact that the viewers of these ads are slightly more likely than the average TV American to be voters.
With this in mind, we can estimate the cost to reach each voter:
(# voters reached /$) ≈ (1000 /10) × 8.6% × 1.5 ≈ 13 voters /$
An average voter has just seen an ad for Bernie Sanders. What impact will this ad have?
While this is a popular topic of study, I couldn’t find many hard numbers aside from those in Franz and Ridout’s 2007 paper Does Political Advertising Persuade? . Franz and Ridout try out a few different models to explain how voter behavior is affected by advertising, and the model that fits their experimental data best seems to suggest the following:
“High-information voters” (≈ 25% of the study) are not statistically affected by advertisements, and the effects on “low-information voters” (≈ 25%) are unpredictable. “Medium-information voters” (≈ 50%), however, have a statistically significant change in perception after exposure to ads, averaging out to a shift of 1 point along the x-axis of the logistic function:

In other words, a “medium-information voter” who had a 50% chance (x=0) of supporting a candidate would, on average, have about a 65% chance (x=1) of supporting that candidate right after seeing an ad for them.
Without bringing too much math into this, it seems reasonable to conclude that the average change of a medium-information voter’s preference after seeing an ad is around 10%. But Franz and Ridout’s study was specifically about general elections, in which voters are much more engaged than in primaries, so let’s cut our estimate in half down to 5% to account for that.
So here’s the simplified model we’ll work with: 50% of voters (the medium-information voters) can have their views affected by TV advertising. Among them, exposure to a pre-Bernie TV ad will on average make each voter 5% more likely to vote for him:
% minds changed = (50 % medium-information voters) × (5 % avg change) = 2.5 %
Putting it all together, we can finally get a (hugely simplified) approximation of the impact of each dollar spent on Bernie Sanders campaign ads:
(13 voters reached /$) * (0.025 extra votes /voters reached) = 0.325 votes /$
or roughly 1 extra vote per $3 spent on advertising.
To illustrate this, here's a little simulation I put together. Right now, the map represents my best estimate of Bernie's current poll numbers relative to Hillary's in each state. Clicking on a state simulates the effects of spending $50,000 on an ad campaign in that state. How much money does it take you to make Bernie win?
Your mileage may vary, but the sweet spot seems to be about $20,000,000 to break even.
Of course, there are a lot of factors this simulation doesn't take into account. For starters, voters' perceptions are influenced by much, much more than just advertising. There's no way we can predict all the myriad of factors that affect voters, but based on how effective Bernie's rallies and stump speeches have been compared to Hillary's so far, let's be generous and say that his natural appeal to voters will do about as much for his numbers as his campaign ads will do. In that case, he'll need to spend only $10,000,000 on ads.
But now we run into the big catch: Hillary will have her own campaign ads, which we can expect to be just as effective. If we model this as a money race, Bernie probably wouldn't stand much of a chance, despite his impressive fundraising last quarter. Let's do it a little differently. Let's say that, of the voters whose minds are changed by Bernie's ads and campaigning, about a quarter become “true believers” – they're convinced for good, and no amount of campaigning or attack ads can change their minds. Under this model, as long as Bernie can spend $40,000,000 on ads, he'll have a strong enough group of uncorruptable voters to win.
Assuming that about a third of the money Bernie raises has to go towards administrative costs – staff salaries, travel expenses, etc. – this means that he needs to get to $80 million from now until the end of the primaries.
How confident am I in the $80 million number? Not very. But it seems as good as any, given how much uncertainty we're dealing with in the primaries as a whole.
So, can Bernie do it? He currently has about $25 million on hand, and given the $26 million he raised last quarter, this goal is certainly within reach.
And, not to be cheesy, but you can help.